
Step 1 – Who uses the centre?
Let's get started!
Click on the arrow below to watch the video
Look at or collect centre data to understand who has been using your centre over the last 12 months or financial year.
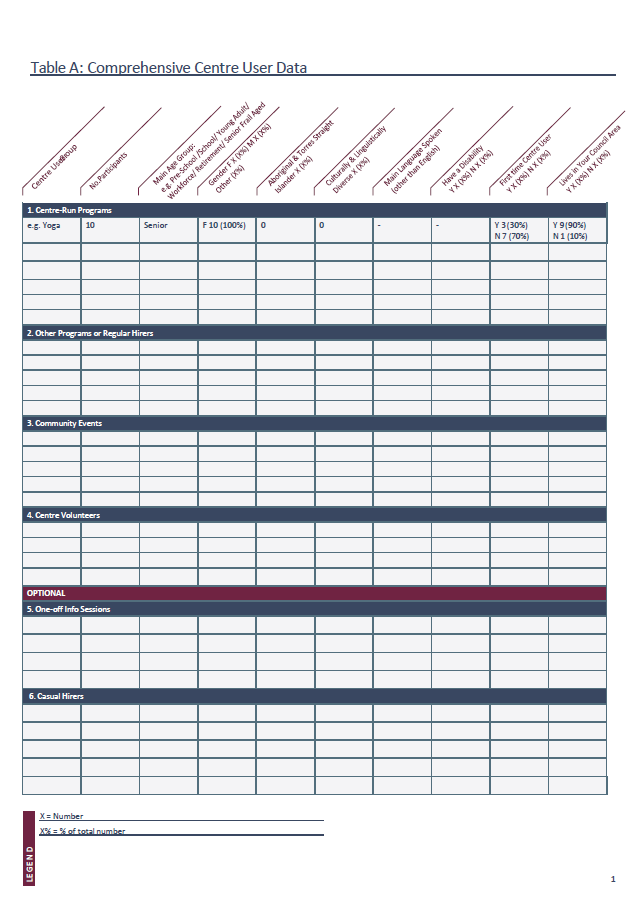
Table A - Comprehensive Centre User Data
Note
If you collect or store data via a database or client management system you may be able to pull a report similar to Table A, in which case, move on to Table B.
If your Centre already collects easily accessible demographic data, review this data over the last financial year or a 12 month period. This will populate Table A and help you identify the main demographic profile of who uses your organisation.
Table A Further Instructions for Completion
As approaches vary in the way Centres collect and record Centre User data we have provided some options on how you can approach Table A.
Click the headings below for more detail
- List each Centre-run program under Section 1 and fill in the main demographic trends of participants (either from collected data or observation). The type of program offered may give some indication of who is accessing your Centre but be sure not to make assumptions. Add in extra rows if required.
- List programs run by other organisations or regular hirers in Section 2 and fill in the main demographic trends of participants. You can ask the lead organisation or hirer for this information or use observation data. Add in extra rows if required.
- List the main community events held at the Centre in Section 3 and fill in the main demographic trends of people who attended. Add in extra rows if required.
- Count the number of Centre volunteers and provide a breakdown of general demographic information as a group. Do not include volunteers here if they have been captured as Centre Users elsewhere in Table A.
- Start with listing all Centre run programs within the 12 month period under Section 1 and all programs run by another organisation or regular hirers within this time period under Section 2.
- For Centre run programs, estimate participant numbers, and the break down of gender and age. For the age break-down, keep it simple by using broad age groups, such as pre-school age, school age, young person, working age, seniors. Or you could use child, adolescent, adult, senior. Keep it as simple as you can.
- Also try to estimate the break down of regular Centre users and individuals who have connected with you for the first time over the 12 month period. Again, do the best you can.
- For programs run by another organisation or regular hirer, ask them for this information and explain why you need it. If they don’t collect any information, then use observational data again.
- Do not make assumptions while completing Table A. It is impossible to know from observation whether a centre user is Aboriginal or Torres Strait Islander or if they speak another language at home. However, the type of program offered may give some indication of who is accessing your Centre (e.g. if it is a social program for people with a disability, an Indigenous Men’s Shed and Afghani Women’s Mothers & Babies Group).
- Provide a breakdown of demographic information of your volunteers as a group – do not include them if they were counted as Centre Users in previous rows.
Optional Steps:
- Add data for community events (Section 3), one-off information sessions (Section 5) or casual hirers (Section 6). This is especially useful if you wish to tell a story of relationships you wish to strengthen, e.g. families that book out the centre for birthday parties or a newly arrived community using the hall for religious gatherings.
- Consider using a Participant Registration form or adapt the Suburb Form to collect specific information from your users for a period of 2-4 weeks. Utilise your volunteers and team members to engage with Centre Users and explain to them the importance of collecting the data.
Extend Your Learning
This article from the Community Toolbox Kit outlines how to develop an observational system for collecting participant data.
Table B - Centre User Data Summary
Note
If you collect or store data via a database or client management system you may be able to pull a report similar to Table B, in which case, move on to Table C in Step 2.
Identify the main demographic trends that have emerged from the data in the Table A (or from your own organisations records or data base) and enter this information in Table B.
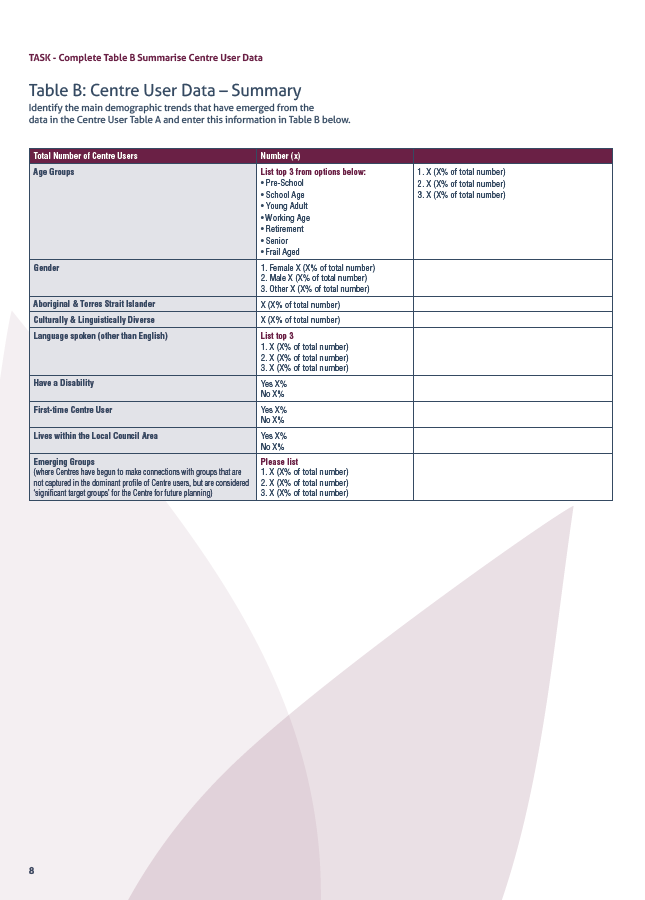
It’s also worth noting here any Emerging Groups – this is where your Centre has begun to make connections with groups that are not captured in the dominant profile of Centre users, but are representative of other groups within the community that you might want to strengthen connections with in the future. This could be the large number of families that hire your facilities for children’s birthday parties or a culturally diverse community group that uses your hall each Sunday for religious gatherings.
When you have summarised the key trends, does anything surprise you about the data you have captured on your Centre-users? Or does it confirm what you already know?
A Moment of Reflection...
- How does your centre collect and store data?
- Is it easily accessible for CNAs or reporting to funders?
- What might you consider to make the process simpler or more detailed?
Share your considerations in the comments section at the bottom of this page.
Table B Further Instructions for Completion
Summarising the data from your centre’s database or Table A does involve some basic mathematics! A percentage calculator might help.
Click the headings below for more detail
To calculate the total number of centre users, add together all of the numbers in the No. Participants column.
Note: Be sure that no participants are being counted twice. For example, if you have a participant that attends two groups or came to a community event as well, they should only be counted in one of these rows.
If it helps with your calculations, note the Total Number of Users on Table B in the column header next to Number (X).
Identify the different age groups you have in your Table A and calculate the number of participants for each. For example, the Main Age Group for Yoga was Seniors which had 10 participants, that’s 10 participants for Seniors (regardless of the age of the remainder of the group). If the next row’s program also had mostly Seniors, the number of participants for that program will be added to the 10 already counted for Seniors.
Once you have determined the number of participants for each Main Age Group, calculate the percentage of the Total Number of Centre Users. For example, if there were 35 Seniors in total and 200 Total Number of Centre Users:
(35 Seniors ÷ 200 Total Users) x 100 = 17.5%
Note: websites like percentage calculator can do this math for you if you do not trust your own calculations.
Calculate the percentage for each Main Age Group. Double check your work by ensuring all percentages added together equals 100%. Then list the top three most prominent in Table B.
From the Gender column, add up all of the female participants and then calculate the percentage from the Total Number of Centre Users.
Repeat for Male and Other and note the percentages for each on Table B. Double check your work by ensuring all percentages added together equals 100%.
Add the total number of participants in the Aboriginal and Torres Strait Islander column. Calculate what percentage this number is of the Total Number of Centre Users.
Repeat this process for the Culturally and Linguistically Diverse and Have a Disability columns.
Identify the different languages noted on your Table A. Similar to the Gender column, calculate the number of participants for each language and then what percentage that number is of the Total Number of Centre Users.
Note the top three most prominent languages on Table B.
Similar to the Gender column, calculate the number of participants who were First Time Center Users and then the percentage of the Total Number of Center Users. Repeat for the participants who were NOT first time centre users. Double check your work by ensuring both percentages added together equals 100%.
Repeat this for the Lives in Your Council Area column.
Scan Table A to see if there are any community groups who have not been represented well in your Table A data. Perhaps, there are groups that you would like to highlight within the Community Events or Casual Hirers.
Consider calculating the total number of those participants and their percentage of the Total Number of Centre Users. Note the top three priority groups on Table B.
Put it into Practice
If you do not have any data of your own to practice with, below you can download Table A and Table B with the example data used in the video.
Download Table A – Example Data below and, using the instructions above, summarise the data into a blank Table B. Then you can check your answers against Table B – Example Data below.
Click on the Next Topic button below to continue.
Download:
- Table A - Comprehensive Centre User Data (links open new window)
- Table B - Summary Centre User Data (links open new window)
- Example Registration Form (printable PDF)
- Example Suburb Form (printable PDF)